Manuscript proposals: [email protected] / 0745 204 115 //// Tracking orders Individuals / Sales: 0745 200 357 / Orders Legal entities: 0721 722 783
ISBN: 978-606-28-0185-4
DOI: 10.5682/9786062801854
Publisher year: 2015
Pages: 182
Publisher: Editura Universitară
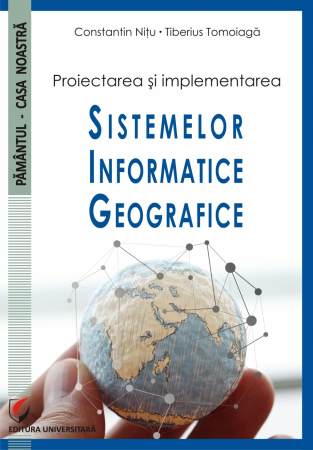
Author: Constantin Nitu, Tiberius Tomoiaga
Product Code:
9786062801854
Do you need help?
0745 200 357
- Description
- Download (1)
- Authors
- Content
- More details
- Reviews (0)
Documentary information about maps shows that they existed before our era: primitive sketches were found in Egyptians, Chinese, Canadians, Native Americans made on a variety of supports, starting from bone, tree bark, sand, wood, stones, etc. The content of these sketches refers to small areas and represents different elements of the natural environment, such as the hydrographic network, lakes, forests, caves.
The oldest map that arrived in Romania, scratched on a silver plate, is from Mesopotamia, dating from the 15th century. XIV-XV i.Cr.
The first actual maps appear in the ancient Greeks. The first Greek map was made by ANAXIMADRU from MILET and includes the known world of his time, surrounded by OKEANOS, in the hypothesis of the flat Earth.
The most remarkable cartographic results in antiquity were the construction of the first geographical globe by CRATES and the imagination of the first projection systems by HIPARH (2nd century BC) and PTOLEMUS (2nd century AD).
The Romans did not enrich in any way the theoretical basis of cartographic representations, even if they also drew up maps called itineraries, necessary in their wars of expansion. One such map is the Peutingerian Tabula.
In feudalism, the development of trade entails the drawing up of maps related to practical needs. Thus, sea maps were built by the Italians, known as portulane, which usually referred to the basin of a single sea.
The 16th century is characterized by a fruitful and valuable cartographic activity, the most important representatives of this period being MERCATOR and ORTELIUS (Dutch). Mercator published in 1578 a first atlas of geographical maps after the maps of Ptolemy, but reconstructed and corrected by him. When drawing up the maps, he uses the cartographic projection and proposes several projections, one of which is for navigation, which bears his name, being used even today.
Sec. The 17th century is known for the appearance of atlases which, in addition to the respective maps, also contained texts.
From the 18th century, it is worth mentioning the activity of drawing up maps on medium and large scales. The first topographic map is Cassini's map of France at a scale of 1: 86400.
In 1871 the first geography congress took place, where the problem of choosing the meridian of origin or the first meridian was raised, problems solved in 1884 at a special conference convened in Washington, when the meridian of the Greenwich observatory was chosen as the meridian of origin.
At the end of the 19th century (1891), at the Bern Congress, for the unification of national topographic maps into an international map, A. Penck's proposal to build a map of the globe at a scale of 1: 1,000,000 was adopted. In 1899 it was decided to draw up a bathymetric map of the Planetary Ocean at a scale of 1: 10,000,000 which appeared in 1904.
Different types of maps and atlases were made between the two world wars. The world-important cartographic work of this period is the Great Soviet Atlas of the World.
After the Second World War, the development of cartography is on the rise, it continues with the preparation of national atlases, topographic maps for the new states, with the appearance of polyglot dictionaries, with the organization of international cartography conferences, etc.
After the stages of "dimensional approximations, geometrization of geography" and "application of statistical methods in geography", the 1960s marked the beginning of the stage of computerization of cartography. This stage is identified with the beginning of geographic information systems (GIS), it being conditioned by the rapid improvement of computers. The first steps were marked by setting up databases, which could later be used by other beneficiaries.
A step forward in the computerization of cartography was the creation of electronic atlases, which can contain, in addition to the information of a traditional database, information under
graphic form (general maps, thematic maps, cartograms, diagram blocks, cartograms, profiles, etc.). Electronic atlases have the advantage of rapidly changing the information contained in graphical form from a present event or geographical phenomenon to a future one, meeting the attribute of "operational" and "functional".
-
Sisteme informatice geografice in cartografie si cadastru
Download
CONSTANTIN NITU
TIBERIUS TOMOIAGA
TIBERIUS TOMOIAGA
Chapter 1. Cartography, realities and perspectives / 9
1.1. Little history of cartography / 9
1.2. Cartography as a science / 12
1.3. Map functions / 15
1.4. Cartographic projections / 17
1.5. The nature of the Z / 21 attributes
1.6. Digital data processing / 31
1.7. New cartographic products / 36
1.8. Conclusions on thematic maps / 38
Chapter 2. General notions of cadastre / 39
2.1. Brief history of the cadastre / 39
2.2. Definition, role, functions and classification of the cadastre / 41
Chapter 3. Geographical data / 49
3.1. Vector data, raster data and grid data / 50
3.2. Organizing data into databases. / 58
3.2.1. Database / 58
3.2.2. BD / 59 design
3.2.3. Geospatial databases / 60
3.3. Creating the cadastral database / 63
3.3.1 Establishing the cadastral entities and their attributes / 63
3.3.2 Establishing the layers of the cadastral database. 64 3.3.3 / Plot / 65
3.3.4 The building / 67
3.3.5 Network / 70
3.3.6 Circulation artery / 70
3.3.7 Owner or holder / 71
3.3.8 Relations between entities / 72
3.3.9 Position database (layers) / 72
3.3.10. Establishment of the database / 74
3.3.11. Database operation / 76
Chapter 4. Statistics and cartography / 78
4.1. History of statistics and geostatistics / 78
4.1.1. Statistics / 78
4.1.2. Geostatistics / 80
4.2. Statistical methods / 80
4.2.1. Tabulation and presentation of data / 81
4.2.2. Measurements of the central tendency / 82
4.2.3. Measures of variability / 83
4.2.4. Correlation / 83
4.3 Mathematical models and statistical models / 84
4.4 Classification of elements, classification systems / 84
4.4.1. Correlation coefficients / 84
4.4.2. Group analysis / 85
4.4.3. Calculation of the amount of classification information / 85
4.5. Construction of statistical maps / 88
Chapter 5. Semiology and thematic cartography / 90
5.1. Definitions of semiotics / 90
5.2. Sign and interpretation / 91
5.3. Graphic semiology / 93
5.4. Inscriptions on maps / 99
Chapter 6. Geographic information systems and cartography / 102
6.1. Geographic information system / 102
6.2. Components of the geographical information system / 105
6.2.1. Space computer system / 105
6.2.2. A practical definition of a geographical information system / 107
6.3. General and dedicated geographical information systems / 109
6.4. Geospatial analysis / 110
6.5. Program packages used in GIS / 111
6.6. Integration in GIS of spatial analysis software packages / 112
Chapter 7. Geostatistics and cartography / 114
7.1. Spatial interpolation / 114
7.2. Exact interpolation methods / 118
7.2.1. / Interpolation with the weight equal to the inverse value of the distance / 118
7.2.2. Kriging Method / 119
7.2.3. The method of the nearest neighbor / 121
7.2.4. Radial base function method / 122
7.2.5. Modified Shepard method / 123
7.2.6. Triangularization with linear interpolation / 123
7.2.7. The natural neighbor method / 124
7.3. Approximate interpolation methods / 125
7.3.1. Polynomial regression method / 125
7.3.2. Local polynomial interpolation / 126
7.3.3. Sliding average method / 126
7.4. Selection ellipse / 127
7.5. Variogram models / 127
7.6. Generation of isocurves and representation of the 3-D / 128 surface
Chapter 8. Maps and cadastral documents / 130
8.1. Projection systems, necessity, use / 130
8.1.1. Generalities / 130
8.1.2. Stereographic projection system 1970/131
8.1.3. 1930 stereographic projection system of Bucharest / 133
8.1.4. System for distributing plan sheets for stereographic projection / 133
8.1.5. Nomenclature for the stereographic projection of Bucharest / 135
8.1.6. Mapping of cadastral plans / 136
8.1.7. The general cadastral plan / 138
8.1.8. Other main documents of the general cadastre / 139
Chapter 9. Cartography using web or telecartography / 142
9.1. The need for cartography using web or telecartography / / 142
9.2. Trends in web cartography / 143
9.3. Users of maps made on the Web / 145
9.4. Cartographic principles for the web / 147
9.5. Publishing maps on the web / 148
9.6. Practical aspects of web map design / 149
9.7. National Agency for Cadastre and Real Estate Advertising and Telecartography / 153
9.8. Tourist maps on the web / 154
9.9. Electronic atlases on the web / 155
9.10. Meteorological maps / 156
9.11. Traffic maps / 157
Bibliography / 159
Annex 1: Comparison of GIS programs by operating system used / 163
Glossary of terms GIS / 165
List of figures / 177
List of tables / 181
Documentary information about maps shows that they existed before our era: primitive sketches were found in Egyptians, Chinese, Canadians, Native Americans made on a variety of supports, starting from bone, tree bark, sand, wood, stones, etc. The content of these sketches refers to small areas and represents different elements of the natural environment, such as the hydrographic network, lakes, forests, caves.
The oldest map that arrived in Romania, scratched on a silver plate, is from Mesopotamia, dating from the 15th century. XIV-XV i.Cr.
The first actual maps appear in the ancient Greeks. The first Greek map was made by ANAXIMADRU from MILET and includes the known world of his time, surrounded by OKEANOS, in the hypothesis of the flat Earth.
The most remarkable cartographic results in antiquity were the construction of the first geographical globe by CRATES and the imagination of the first projection systems by HIPARH (2nd century BC) and PTOLEMUS (2nd century AD).
The Romans did not enrich in any way the theoretical basis of cartographic representations, even if they also drew up maps called itineraries, necessary in their wars of expansion. One such map is the Peutingerian Tabula.
In feudalism, the development of trade entails the drawing up of maps related to practical needs. Thus, sea maps were built by the Italians, known as portulane, which usually referred to the basin of a single sea.
The 16th century is characterized by a fruitful and valuable cartographic activity, the most important representatives of this period being MERCATOR and ORTELIUS (Dutch). Mercator published in 1578 a first atlas of geographical maps after the maps of Ptolemy, but reconstructed and corrected by him. When drawing up the maps, he uses the cartographic projection and proposes several projections, one of which is for navigation, which bears his name, being used even today.
Sec. The 17th century is known for the appearance of atlases which, in addition to the respective maps, also contained texts.
From the 18th century, it is worth mentioning the activity of drawing up maps on medium and large scales. The first topographic map is Cassini's map of France at a scale of 1: 86400.
In 1871 the first geography congress took place, where the problem of choosing the meridian of origin or the first meridian was raised, problems solved in 1884 at a special conference convened in Washington, when the meridian of the Greenwich observatory was chosen as the meridian of origin.
At the end of the 19th century (1891), at the Bern Congress, for the unification of national topographic maps into an international map, A. Penck's proposal to build a map of the globe at a scale of 1: 1,000,000 was adopted. In 1899 it was decided to draw up a bathymetric map of the Planetary Ocean at a scale of 1: 10,000,000 which appeared in 1904.
Different types of maps and atlases were made between the two world wars. The world-important cartographic work of this period is the Great Soviet Atlas of the World.
After the Second World War, the development of cartography is on the rise, it continues with the preparation of national atlases, topographic maps for the new states, with the appearance of polyglot dictionaries, with the organization of international cartography conferences, etc.
After the stages of "dimensional approximations, geometrization of geography" and "application of statistical methods in geography", the 1960s marked the beginning of the stage of computerization of cartography. This stage is identified with the beginning of geographic information systems (GIS), it being conditioned by the rapid improvement of computers. The first steps were marked by setting up databases, which could later be used by other beneficiaries.
A step forward in the computerization of cartography was the creation of electronic atlases, which can contain, in addition to the information of a traditional database, information under
graphic form (general maps, thematic maps, cartograms, diagram blocks, cartograms, profiles, etc.). Electronic atlases have the advantage of rapidly changing the information contained in graphical form from a present event or geographical phenomenon to a future one, meeting the attribute of "operational" and "functional".
The oldest map that arrived in Romania, scratched on a silver plate, is from Mesopotamia, dating from the 15th century. XIV-XV i.Cr.
The first actual maps appear in the ancient Greeks. The first Greek map was made by ANAXIMADRU from MILET and includes the known world of his time, surrounded by OKEANOS, in the hypothesis of the flat Earth.
The most remarkable cartographic results in antiquity were the construction of the first geographical globe by CRATES and the imagination of the first projection systems by HIPARH (2nd century BC) and PTOLEMUS (2nd century AD).
The Romans did not enrich in any way the theoretical basis of cartographic representations, even if they also drew up maps called itineraries, necessary in their wars of expansion. One such map is the Peutingerian Tabula.
In feudalism, the development of trade entails the drawing up of maps related to practical needs. Thus, sea maps were built by the Italians, known as portulane, which usually referred to the basin of a single sea.
The 16th century is characterized by a fruitful and valuable cartographic activity, the most important representatives of this period being MERCATOR and ORTELIUS (Dutch). Mercator published in 1578 a first atlas of geographical maps after the maps of Ptolemy, but reconstructed and corrected by him. When drawing up the maps, he uses the cartographic projection and proposes several projections, one of which is for navigation, which bears his name, being used even today.
Sec. The 17th century is known for the appearance of atlases which, in addition to the respective maps, also contained texts.
From the 18th century, it is worth mentioning the activity of drawing up maps on medium and large scales. The first topographic map is Cassini's map of France at a scale of 1: 86400.
In 1871 the first geography congress took place, where the problem of choosing the meridian of origin or the first meridian was raised, problems solved in 1884 at a special conference convened in Washington, when the meridian of the Greenwich observatory was chosen as the meridian of origin.
At the end of the 19th century (1891), at the Bern Congress, for the unification of national topographic maps into an international map, A. Penck's proposal to build a map of the globe at a scale of 1: 1,000,000 was adopted. In 1899 it was decided to draw up a bathymetric map of the Planetary Ocean at a scale of 1: 10,000,000 which appeared in 1904.
Different types of maps and atlases were made between the two world wars. The world-important cartographic work of this period is the Great Soviet Atlas of the World.
After the Second World War, the development of cartography is on the rise, it continues with the preparation of national atlases, topographic maps for the new states, with the appearance of polyglot dictionaries, with the organization of international cartography conferences, etc.
After the stages of "dimensional approximations, geometrization of geography" and "application of statistical methods in geography", the 1960s marked the beginning of the stage of computerization of cartography. This stage is identified with the beginning of geographic information systems (GIS), it being conditioned by the rapid improvement of computers. The first steps were marked by setting up databases, which could later be used by other beneficiaries.
A step forward in the computerization of cartography was the creation of electronic atlases, which can contain, in addition to the information of a traditional database, information under
graphic form (general maps, thematic maps, cartograms, diagram blocks, cartograms, profiles, etc.). Electronic atlases have the advantage of rapidly changing the information contained in graphical form from a present event or geographical phenomenon to a future one, meeting the attribute of "operational" and "functional".
If you want to express your opinion about this product you can add a review.
write a review

6359.png)
![Geographic Information Systems in cartography and land [1] Geographic Information Systems in cartography and land [1]](https://gomagcdn.ro/domains/editurauniversitara.ro/files/product/large/sisteme-informatice-geografice-in-cartografie-si-cadastru-817-900045.jpg)


